The first half of 2026 delivered a familiar cast of characters—AI excitement, interest rate uncertainty, and geopolitical risk—playing out against a backdrop that keeps getting more complicated. Here is what we are watching and how we are positioned.
The Three Themes that Won't Leave
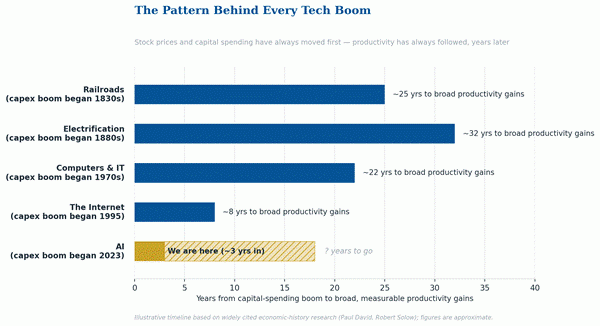
AI remains the market's central narrative and a genuine engine of economic growth. Hyperscale capex is propping up U.S. GDP, and the capital investment boom is real. But history offers a sobering frame: across two centuries of technological transformation, productivity gains tend to arrive long after stock prices and capital spending have already surged. We are still in the early chapters.
In plain terms, every major wave of new technology has followed the same script. Investors get excited, money pours into building the infrastructure, and stock prices rise—years before the technology actually makes the economy more productive. Railroads, electricity, personal computers, and the internet all followed this pattern. AI is very likely following it, too.
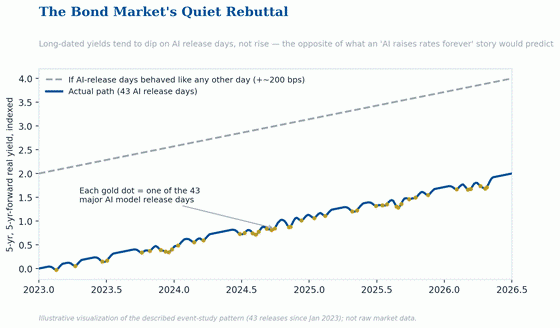
Meanwhile, the bond market is quietly pushing back on the notion that AI will drive interest rates permanently higher. Event studies tracking 43 major AI model releases since January 2023 show that long-dated yields have actually fallen on those days—not risen. The crowd applauds; the bond market checks its watch.
Here is why that matters. If AI were truly convincing investors that it would supercharge long-run economic growth, we would expect long-dated bond yields to climb on the days big AI breakthroughs are announced—more growth usually means higher borrowing costs down the road. Instead, the opposite happens: yields tend to dip slightly on those exact days. Add it up over the past three-plus years, and the gap is substantial—excluding the 43 release days, long-dated yields would have climbed roughly 200 basis points more than they actually have. The stock market cheers each new model. The bond market, which is arguably the more skeptical read on long-run growth, isn't buying the “permanently higher rates” story yet.
AI's reach now extends into specific industries. Consider insurance. The common assumption is that AI will revolutionize the precision of underwriting. We think that the case is overstated. Actuaries have run massive regressions on large datasets for decades, and each added layer of complexity yields diminishing returns. The refinements will be modest, not transformative.
The more compelling opportunity is narrowing the gap between buyers and sellers. Today, agents and brokers sit between nearly every property and casualty transaction, collecting high-teen commissions that policyholders ultimately pay—often without clear disclosure. Agentic AI could change that. A large-language-model-powered “digital agent” can already compare dozens of policies side by side and explain the differences instantly. For small-ticket buyers—a warehouse policy in a small town or business coverage for a florist—the needs are simply not that complex. Evidence of this shift remains scarce, but the combination of direct-to-consumer capability and agentic AI may prove to be the tipping point.
Interest Rates: The Plot Twist Nobody Ordered
Investors entered 2026 expecting rate cuts. They are now pricing in hikes. The Fed faces a 4.2% CPI print, energy-driven inflation, and an economy that refuses to roll over quietly.
The good news: historically, modest rate increases—50 to 100 basis points—driven by stronger growth have coincided with advancing equity markets. Rate increases of 200 basis points or more are a different story entirely. Bond market pricing currently points toward the former. The distinction matters enormously for how portfolios should be constructed.
History backs this up with real examples. The Fed's gradual, 25-basis-point-at-a-time cycles—2004 to 2006 and 2015 to 2018—both coincided with solid equity gains, even though rates rose substantially over those years. The fast, large cycles—1994's rapid 300-basis-point increase and 2022's aggressive 525-basis-point sprint—both coincided with flat-to-sharply-negative equity returns. Pace and size, not direction, have historically been what moves markets.

There is a portfolio consequence that deserves attention. For the two decades through 2020, core inflation averaged about 2% and stocks and bonds moved in opposite directions—a gift for diversification. Since 2021, higher inflation has flipped that relationship to a positive correlation, more like earlier high-inflation eras. Traditional diversification is working harder than it used to.
Political and Geopolitical Uncertainty: The Energy Shock and the Consumer
The year's most disruptive event was geopolitical. The conflict in Iran and the closing of the Strait of Hormuz—which handles 35% of global crude exports—sent oil as high as $120 per barrel after two years of falling prices. The futures curve shifted higher and into backwardation, with current prices exceeding those of futures contracts. Encouragingly, the shape of that curve suggests the market expects a relatively quick resolution followed by a steady price decline.

The strain on physical supply was real. A U.S. naval blockade in April limited tanker traffic and rapidly drained global inventories. At current withdrawal rates, U.S. reserves could approach “tank bottom”—an estimated 150 to 250 million barrels—by mid-September, depending on hurricanes and export shifts. Copper, essential to the AI buildout, electric vehicles, and renewables, has also come under pressure from the Strait's closure, creating bottlenecks that raise costs across projects.
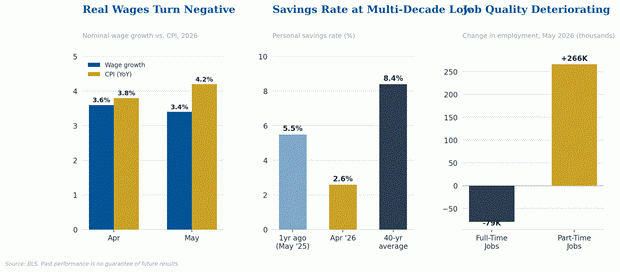
The most concerning ripple effect landed on the American consumer, and this is where the story turns cautionary. Consumer spending makes up roughly 68% of U.S. nominal GDP, making household health the single most important variable in any forecast. Q1 GDP was revised down from 2% to 1.6%, largely on weaker consumption.
The most underappreciated risk in 2026 is the American consumer. The personal savings rate fell to 2.6% in April—a multi-decade low against a long-term average of 8.4%. Real wages turned negative in May as CPI outpaced nominal wage growth. Credit card and auto delinquencies have surpassed levels seen during the Global Financial Crisis.
The May payroll report looked fine on the surface. Beneath it, 79,000 full-time jobs were lost while 266,000 part-time positions were added. That is not the composition of a labor market firing on all cylinders. The consumer is not broken—but the engine is running hotter than the dashboard suggests, and that reality tempers our optimism and shapes how we position portfolios.
What Makes This Market Look Different
The instinct is to compare 2026 to the late 1990s. It is a useful analogy—and an incomplete one.
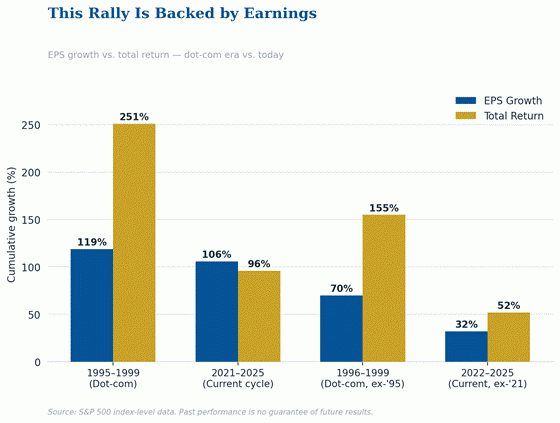
From 1995 to 1999, total S&P 500 returns of 251% ran well ahead of earnings growth of 119%. Prices outran profits. Today, the reverse is true. Over the past five years, earnings growth of 106% has actually exceeded total returns of 96%. The earnings support ratio—EPS growth divided by total return—is 110% in the current period, compared with 48% in the late 1990s. This rally is resting on profits, not on pure enthusiasm.
Leadership is also quietly broadening. As of June 11, the equal-weighted S&P 500 (up 8.3%) has overtaken the cap-weighted index (up 6.3%). Sixty percent of S&P 500 stocks now trade above their 200-day moving average. Concentration at the top remains real, but the foundation beneath it is wider than the headlines imply.

That broadening shows up clearly at the sector level, too. Comparing where leadership stood over the trailing 12 months against where it stands year-to-date in 2026 tells a rotation story. Energy has vaulted from dead last to the top of the leaderboard, powered entirely by the oil shock. Technology and Communication Services remain strong but have ceded a bit of ground as other areas catch up. Financials and Industrials have both climbed, helped by a higher-rate environment and hyperscale infrastructure spending, respectively. On the other side, the rate-sensitive and consumer-exposed corners of the market—Real Estate, Utilities, and Consumer Discretionary—have slipped, consistent with a stretched consumer and a Fed that is hiking rather than cutting.
Q2 Earnings: The Year's Critical Test
The test comes in mid-July when Q2 earnings season opens. With 2026 gains driven almost entirely by earnings growth rather than higher multiples, Q2 results represent the most serious test of the rally's structure. The market has little tolerance for disappointment: companies missing estimates are already being punished with an average 4.2% decline, well above the historical norm of 2.9%.
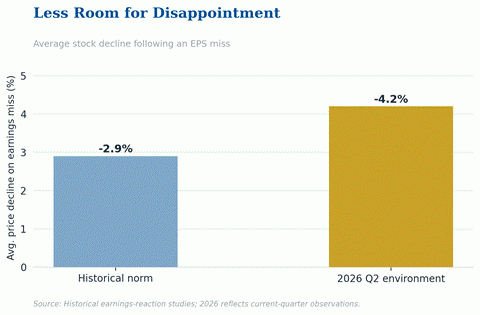
Valuations amplify the stakes. The S&P 500 trades at roughly 21 times forward earnings—richer than about 87% of observations over the past 40 years. Near-record profitability and relatively contained interest rates help justify that multiple, but the margin for error is thin. Recent volatility, including the June 5 sell-off that hit AI-linked growth and semiconductors hardest, confirms the shift. The cycle has not broken. The market has simply become less forgiving.
How Fortis is Positioned
Our reading of this environment leads to a clear conclusion. Innovation remains the market's central narrative, but chasing the most exciting growth theme is not the right response to elevated valuations, concentrated leadership, and rising volatility. Balance and breadth matter more than ever.
On bonds: Strong growth can coexist with meaningful rate volatility, as the 1990s demonstrated. Stronger data can quickly pressure duration. The difference today is that yields finally provide a genuine income cushion—something absent for much of the post-GFC era. We favor shorter-duration, higher-quality bonds that let clients participate without overextending on rate or credit risk.
On stocks: We are leaning into breadth. Our positioning emphasizes:
● Durable AI beneficiaries rather than the most speculative growth names
● Select small- and mid-cap cyclicals, which stand to benefit from hyperscaler infrastructure spending and are positioned to gain as rate pressures ease
● Equity income stocks, which carry far less thematic AI concentration than the broad index
● Developed international equities, supported by a weaker dollar and improving global manufacturing conditions, from European fiscal spending to Japan's corporate governance reform,
● In the material sector, it is imperative to be selective about names, where inflation dynamics and elevated commodity prices create opportunity
● Large-cap security selection, where broadening leadership is opening genuine opportunities
The thread is simple. Some of the best opportunities are hiding in plain sight, spread across the equity spectrum rather than crowded into a handful of familiar names. We encourage a thoughtful review of portfolio breadth. Concentration risk is easy to accumulate and easy to overlook.
The Bottom Line:
The 1990s comparisons are instructive but imperfect. This market has speculative corners, but it also has earnings support, widening participation, and higher starting yields than the dot-com era ever saw. That combination argues for staying invested with discipline—balancing exposure to innovation against durable, diversified earnings.
Same story, next chapter. We are positioned to navigate it with patience and precision.