
Q4 Market Outlook: The Case for a Year-End Rally
Heading into the fourth quarter, the setup is unusual: the market sits within reach of all-time highs, and yet investor sentiment just hit one of its most bearish readings in years. In our view, that combination makes the case for the rally carrying through year-end.
Investors Are Very Bearish
In the two weeks leading up to the September Fed meeting, investors turned negative faster than at any point in more than three years. As of mid-September, sentiment was the lowest it had been since the tariff selloff in early 2025.
In the AAII survey for the week ending September 16, 53.3% of respondents said they were bearish. The long-run bearish average is 31.5%. Only 28.8% were bullish. The gap between bulls and bears fell 26.6 points in two weeks, to −24.5. Fewer people were neutral too, at just 17.9%. Since the survey began in 1987, bearish readings above 50% have shown up in fewer than one week out of twenty.
What is the AAII survey? Since 1987, the American Association of Individual Investors has asked its members one question each week: do you expect the market to be higher, lower, or unchanged six months from now? The tallies — bullish, bearish, neutral — make it one of the longest-running measures of how ordinary investors actually feel. It’s most telling at the extremes, where it tends to work as a contrarian signal: crowds are rarely this pessimistic at tops.
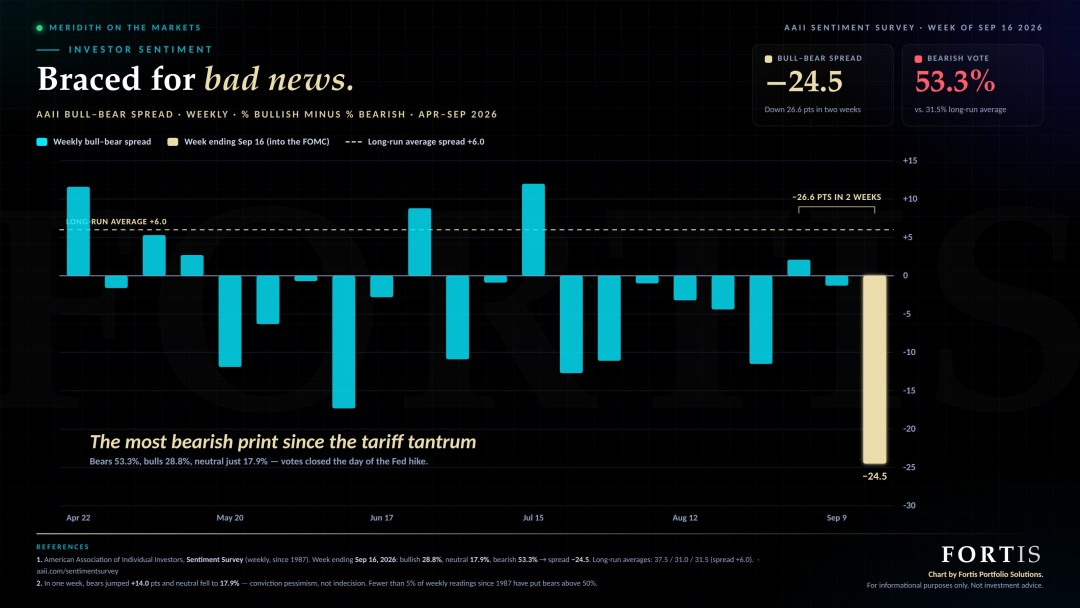
AAII bull–bear spread, weekly, Apr–Sep 2026. Source: AAII Sentiment Survey.
Why does that matter for the path ahead? Because the bullish reading relative to historical market returns suggests a strong likelihood of positive gains over the next 3, 6 and 12 months. But exceptions do matter, particularly in the case of July 2008, which was followed by steep losses. Low bullishness has a good record for poisitive returns for stocks, but it doesn’t protect when an unexpected crisis-driven bear market.
Another important point is the concentration of technology positions held by institutions and investors. The massive capital gains in the Magnificent Seven stocks are unlikely to be realized anytime soon. The AI story is still the main game in town
The Fed: What the Dots Actually Said
The larger point is the Fed itself. We don’t believe September’s message came anywhere near hawkish enough to justify the selloff many had braced for — if anything, the projections leaned the other way.
In our last note, we wrote that if the Fed treats this as a one-time hike to protect its credibility, markets should keep climbing. We also said a hike might finally pull long-term rates down. The Fed now expects one more hike than we did, but the overall path is what matters.
The new projections show one more increase this year. After that, the Fed expects to hold rates at 4.1% through the end of 2027 and then lower them slowly toward a long-run level of 3.2%. That describes a peak followed by a long pause. The bearish case for stocks is a Fed that keeps raising rates for years, and these projections point away from that.
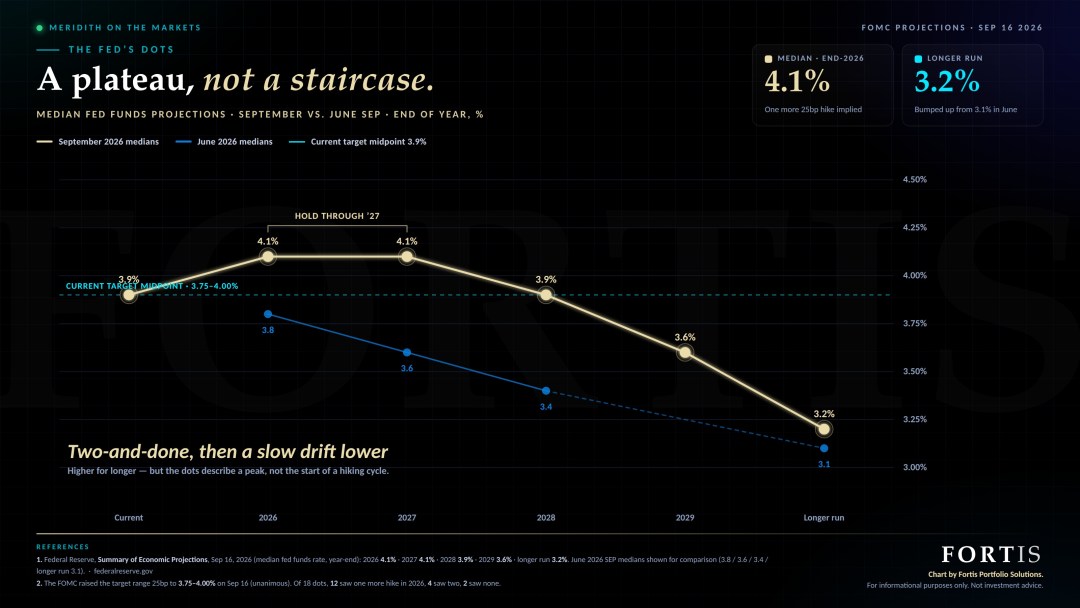
Median fed funds projections, September vs. June SEP. Source: Federal Reserve, Sep 16, 2026.
Financial Conditions: Room to Ease
We look at three things to judge financial conditions: interest rates, oil, and the dollar. Leaving the dollar aside, none of them looks especially loose right now.
Many popular indexes say conditions are very easy. But most of them include the stock market in their calculation, so when stocks are near highs, conditions automatically look loose. The Chicago Fed’s index leaves that out. It reads −0.56, which is easier than average. But in the 2022 rate-hiking cycle it never rose above −0.10. The loosest readings were −1.10 in 1993 and −0.70 in 2021. So conditions could tighten from here, but they could also ease a lot more, and that would help stocks.
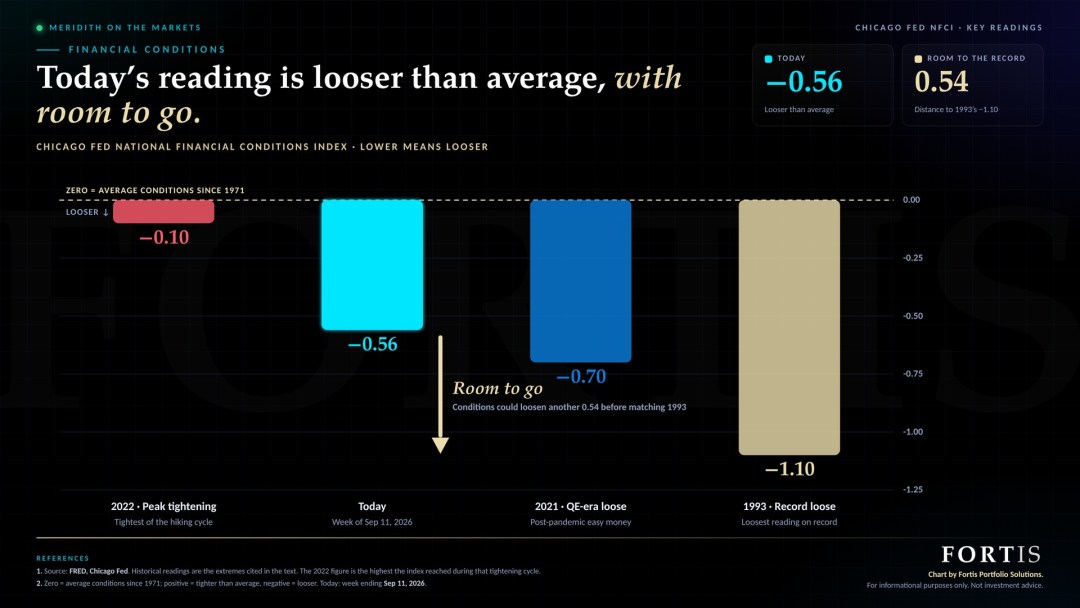
The bottom line.
Markets rarely reward the consensus when most of the crowd is bearish. Right now the crowd is braced for trouble. None of this is a forecast etched in stone, and none of it replaces longer time-horizon market themes. Markets can and will surprise in both directions, and the right response to a promising setup is not abandonment — it’s discipline. However, if the question is whether the weight of the evidence favors the bulls or the bears into year-end, our answer is the one the table has been pointing to all along: the setup favors the bulls.
How quickly can things change? Fast — but mostly in one direction. Markets take the elevator down and the stairs back up. In the ten weeks around COVID, the index swung from −0.62 to +0.31 — a decade’s worth of movement in one quarter. Getting loose again took the rest of the year and a Fed fire hose to adjust quickly. In a calm market, the needle barely moves — even the 2025 tariff tantrum only nudged it about 0.12. The level tells you where you are. The speed tells you if something’s on fire. If the speed were to more sharply increase, we woould be re-evaluating our allocations to stocks and bonds.
What would make these readings drop? (Remember — lower means looser.) Nothing fancy: the Fed stops hiking and the market starts pricing cuts, credit spreads come in as recession fears fade, and the dollar and oil behave. That first one is literally what September’s dots just promised. The path to looser conditions doesn’t require anything exotic — just the Fed showing up and doing what it already wrote down.
Is the Fed doing its own homework? It’s grading it, actually — the NFCI is published by the Chicago Fed, so the people setting financial conditions are also handing out the report card. To their credit, they know how that looks, and they publish a second, “adjusted” version that strips out the feel-good economic backdrop. So yes, the homework gets done. Our question is which answer key they’re using — the market-heavy indexes that say everything’s fine, or the rates-oil-dollar lens that says there’s still slack in the rope.
We have our hand on the pulse. Potential changes — in either direction — in the charts above are just a few of the indicators we’re keeping a watchful eye on. Thank you for trusting our guidance on the financial markets.
— Meridith on the Markets
Data: AAII Sentiment Survey (week ending Sep 16, 2026); Federal Reserve Summary of Economic Projections (Sep 16, 2026); Federal Reserve Bank of Chicago NFCI via FRED (week ending Sep 11, 2026). For informational purposes only. Not investment advice.